Federal budget decisions made in Washington directly affect daily life in the Champlain Islands — from farm subsidies and Medicare to school funding. infrastructure, and income from tourism. This page focuses on factual budget information from nonpartisan sources.
Understanding how Federal money is raised and spent helps us advocate more effectively for our neighbors and our community. We believe informed citizens make better advocates.
Consumer Sentiment Charts
The Federal Reserve Bank publishes the University of Michigan Consumer Sentiment graph: https://fred.stlouisfed.org/series/UMCSENT.
Understanding how consumers experience or view the economy helps us prioritize actions.
Where Your Tax Money is Going Now
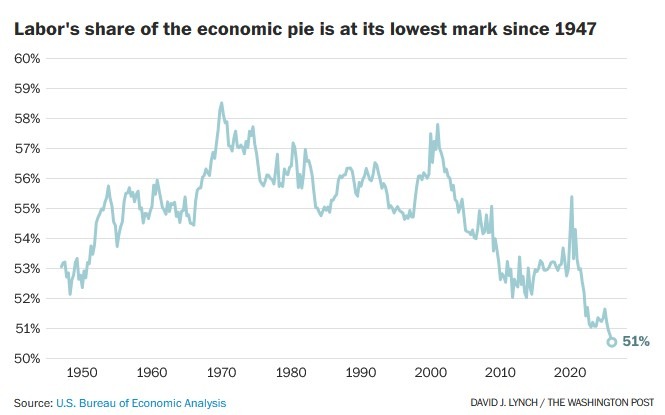
Why are so many of us getting poorer? The Federal budget determines national spending priorities. These nonpartisan resources help us understand how our tax money is spent:
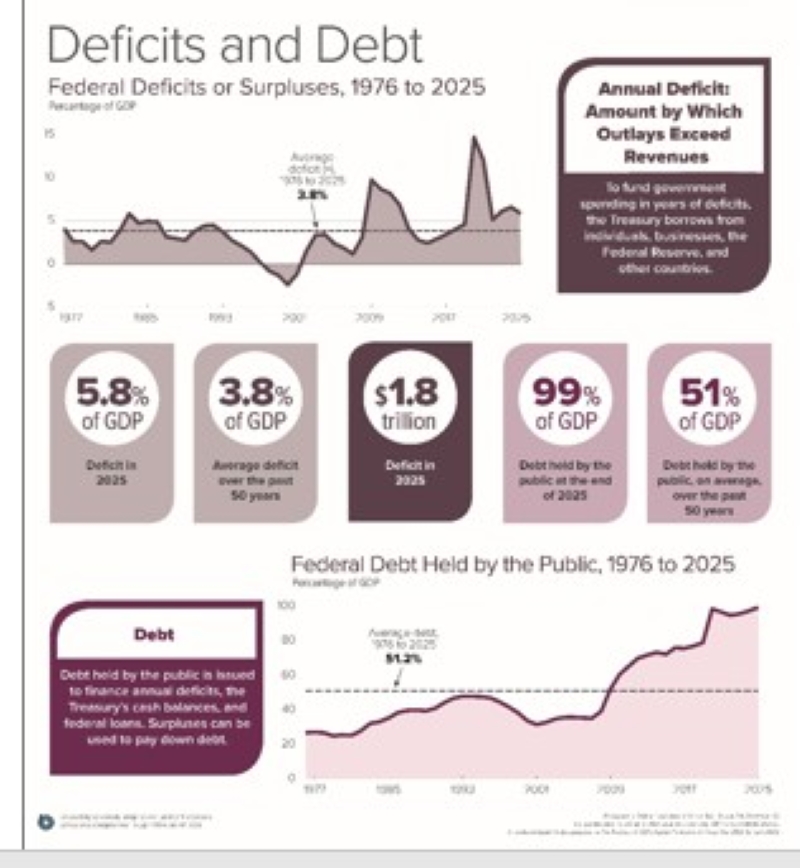
Historical Charts (2024) — for budget context & scale; click to enlarge view
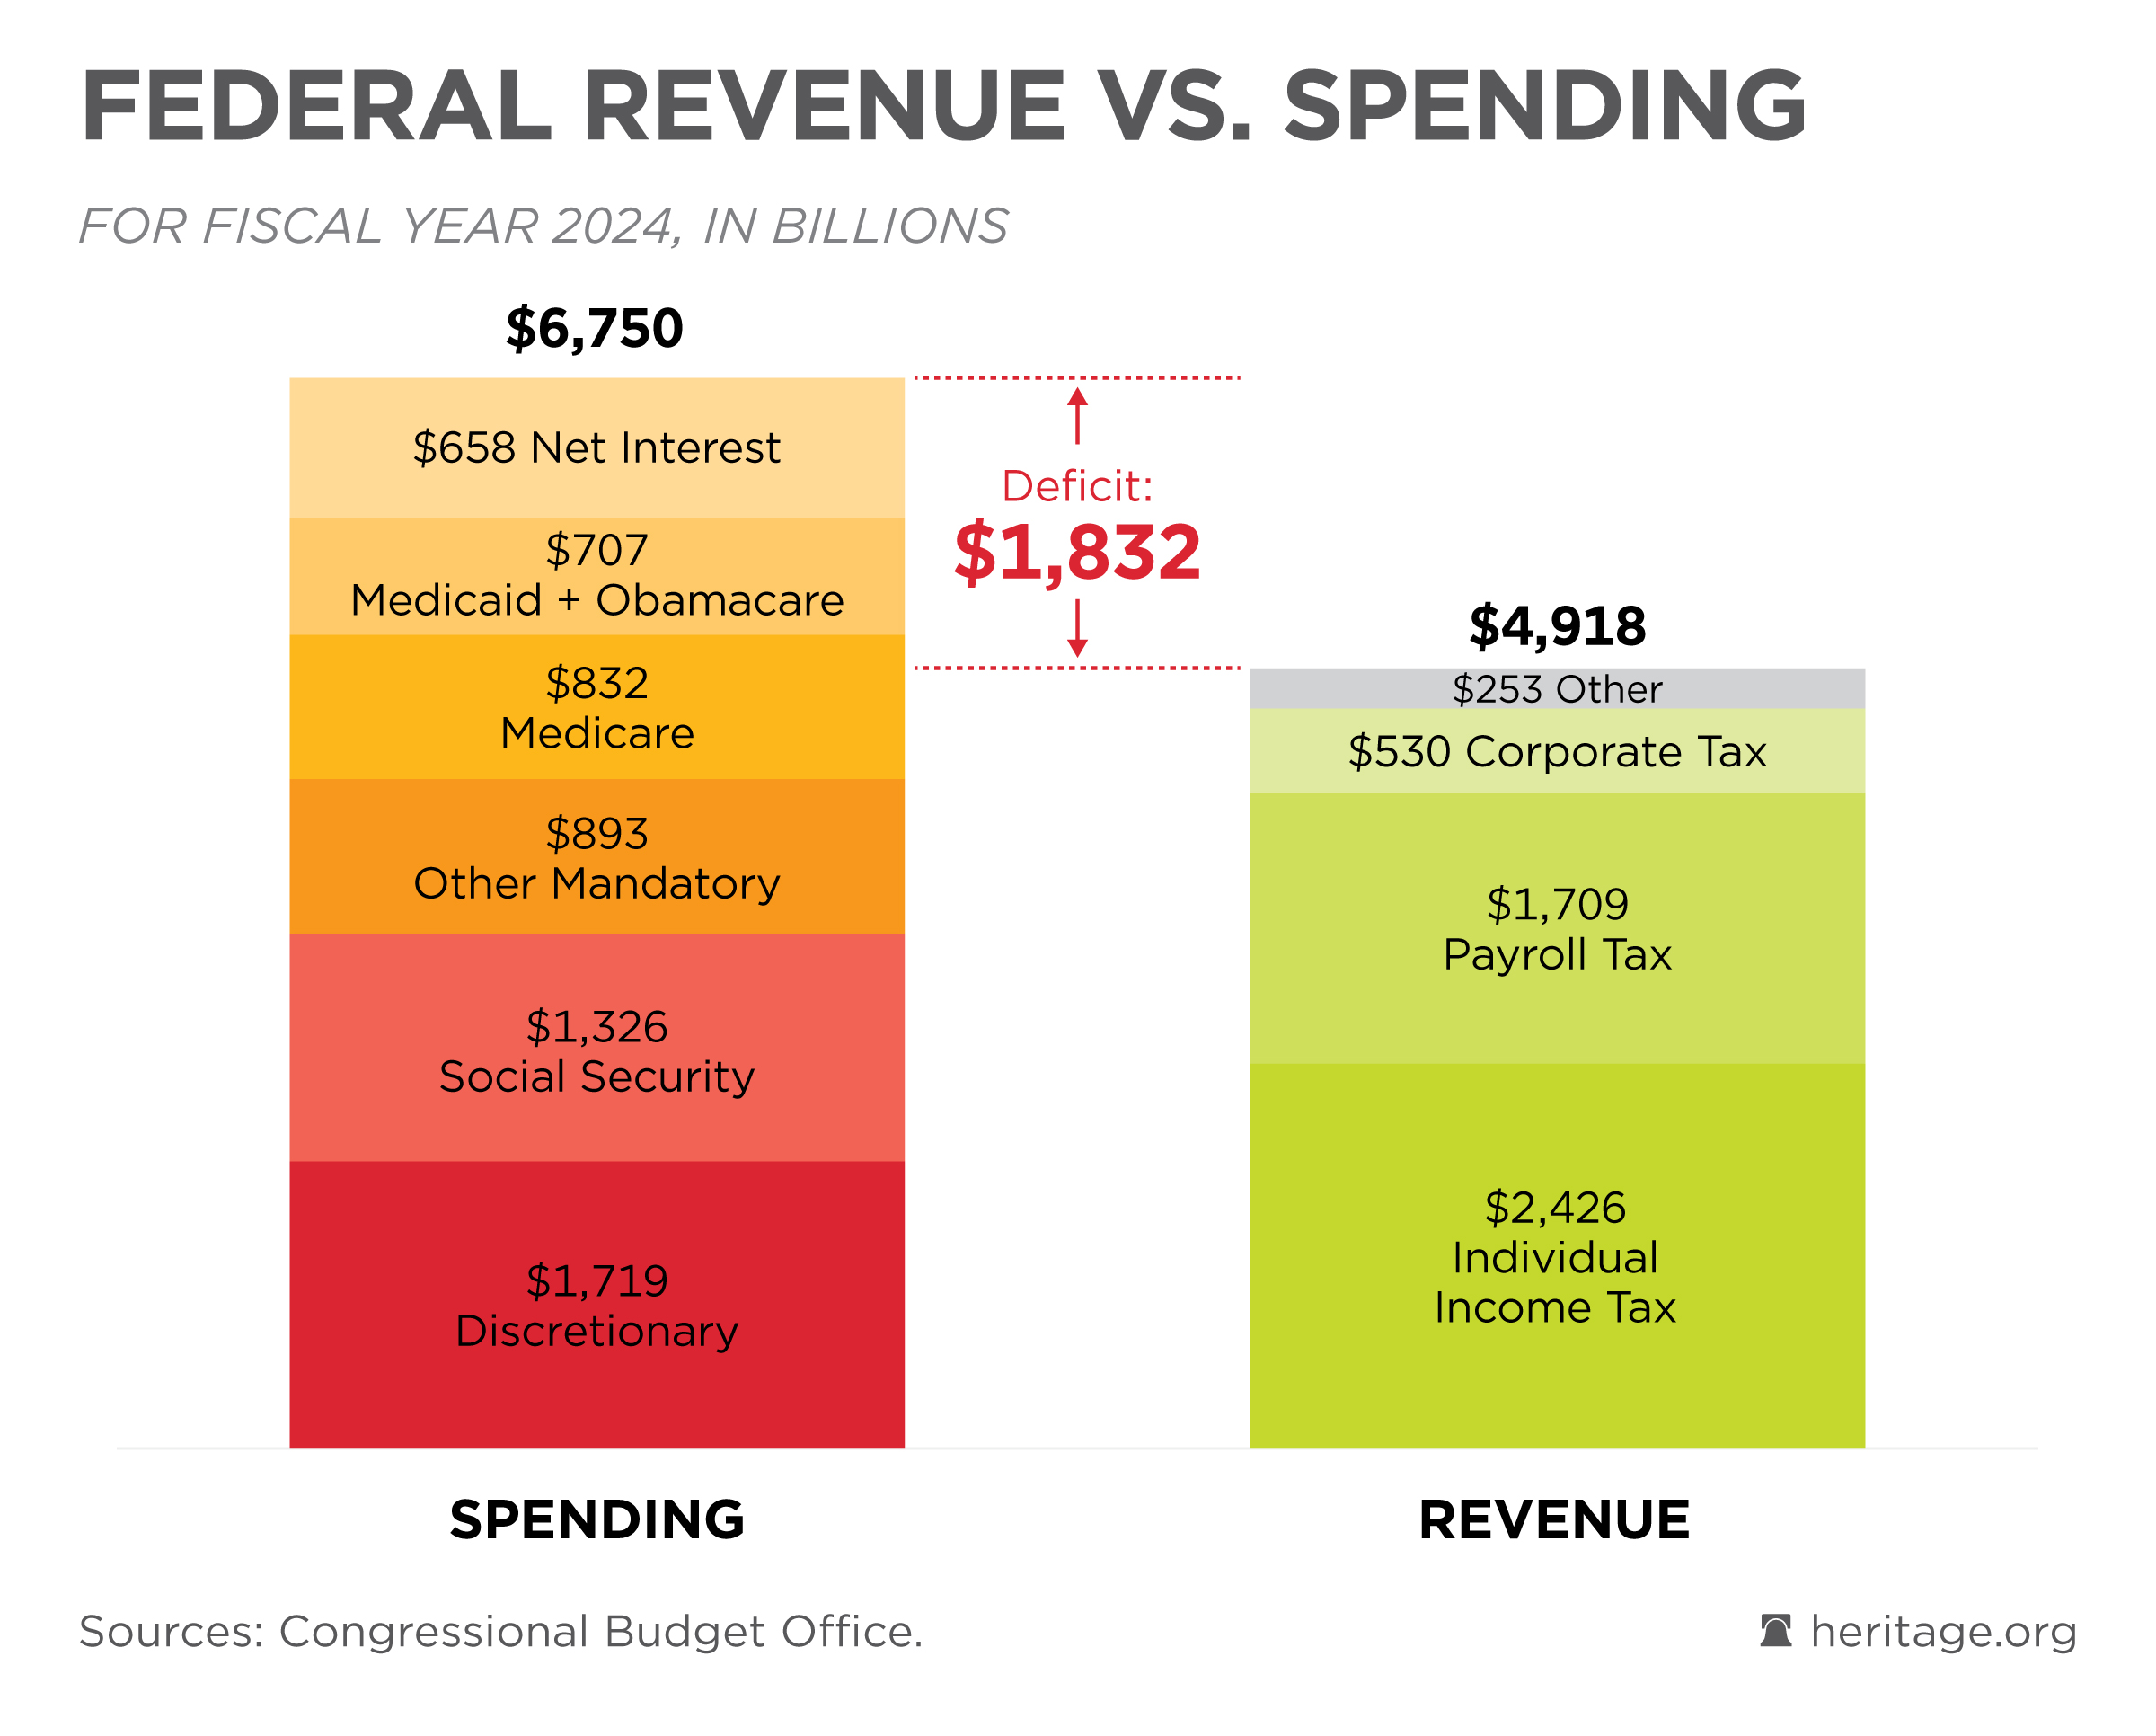
- Congressional Budget Office (CBO) Federal Budget Charts — Federal Spending vs. Revenue = Deficit
- Congressional Budget Office provides official nonpartisan budget analysis, resources, and data
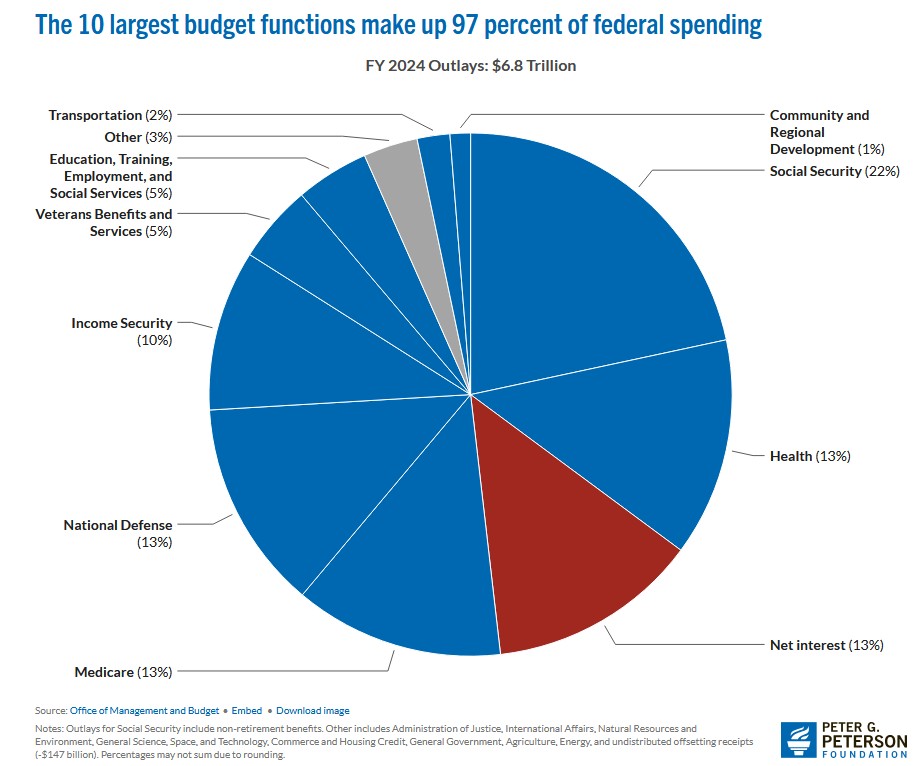
- Peter G. Peterson Foundation — charts and explainers on federal spending and the national debt (subscription service).
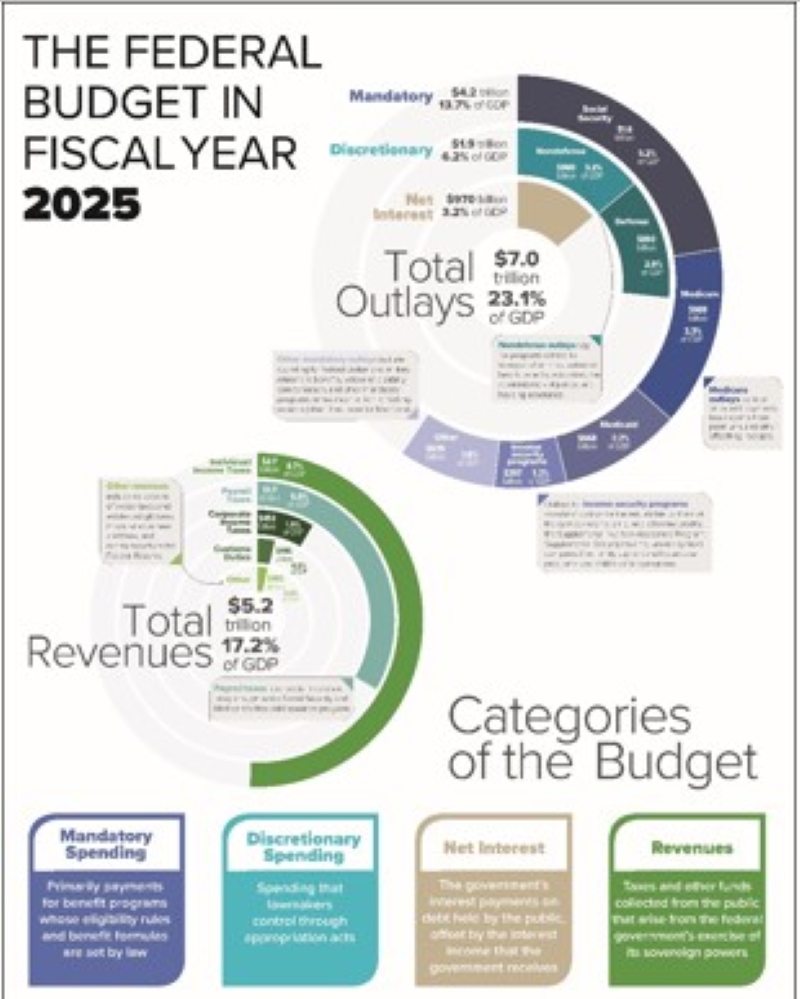
Fiscal Year 2025 budget (source CBO); click to enlarge view
Live Current Data Trackers of Government Spending
USAFacts.org — Most visual; charts shows revenue flow into spending categories
USASpending.gov — official federal database showing exactly where government money goes
Taxpayers for common Sense, an independent, nonpartisan watchdog dedicated to protecting the nation’s fiscal future since 1995.
Unnecessary Spending instead of Badly Needed “Basics”
Whether you are a Republican, Democrat or Independent, we should all agree that responsible spending is essential to good governance. Wasteful, unnecessary expenditures such as these erode our confidence.
War with Iran
- Iran War Cost Ticker
- Harvard Kennedy School
- Brown University Watson School of International & Public Affairs
Other military spending
Cost of U.S. Military operations in Venezuela, Caribbean, Eastern Pacific 8/1/25–3/31/2026
“Luxury” spending
- Lavish White House ballroom, 90,000 square feet, replacing the East Wing: $250 Million (and going up)
- Excessive luxury travel: estimated at $800,000 most weekends for Trump to travel to his private club in Florida.
How This Affects Vermont & the Champlain Islands
- Increased cost of gas and fuel — affects working parents and businesses — all of us
- Medicare cuts hit families; Medicaid cuts hurt seniors on fixed incomes
- Farm subsidies and agricultural policy affect our farmers
- Immigration restrictions reduce our
- local farm labor supply — which hurts dairy, orchard, and truck farmers
- local construction worker supply — which results in fewer houses built, and at higher cost
- Education funding affects our struggling local schools
- The president’s “Make Canada the 51st State” statements, on top of the tariffs he imposed on Canadian goods, has antagonized our Canadian neighbors. As a consequence, Vermont has experienced an estimated 28% drop in Canadian tourist visits, and Canadians have avoided purchasing Vermont products. This Canadian boycott has directly damaged many of our local businesses.
Track Current Legislation & Spending
- GovTrack — track bills in Congress
- ProPublica Congress API — Follow your representatives’ voting records
- OpenSecrets — follow the money in politics